

Solar’s Odyssey- Part 1 - The Journey into your home
Do the numbers stack up for households?


Homer's odyssey tells the story of Greek Trojan War hero Odysseus' 10-year journey to return to his home Ithaca after the 10-year Trojan War. In some respects the story of solar is similar in that it has taken 20 years to bring down the cost of panels by an online purported 60-75% and taken 20 years for households to welcome solar into their homes in large numbers. Of the 29.9mm UK households, 1.4mm now have installed solar panels with much of this in the last few years (almost certainly facilitated by the increase in energy prices) and this trend looks set to continue. Do the numbers stand up to analysis then?
A bit of housekeeping
There are multiple possible inputs you can use here. For completeness I list the working assumptions below, but feel free to skip forward to the results if this is a bit dense:
This analysis looks at the average, there will be differences at a household level, depending on your energy usage patterns. For example, if you work from home or are at home all day, the likelihood is that you will use more of the energy that you produce. Alternatively, if you commute to work you likely consume most of your energy in the morning and the evenings. Why does this matter? Well simply, if you use your white goods and TV at night when the sun isn’t shining then you can’t use what you produce. There is an alternative in that you could add battery storage, but I do not include this in the analysis as the cost of batteries is so prohibitive it would make the rest of the analysis redundant. So, if you are reading this and think that you can use 90-100% of what you make, then solar panels make a lot of sense, and you needn’t go into the weeds of the analysis. However, this piece is not for you per se, this is for the average household, for whom they export around 60% of what they produce according to Good energy.
What price can you export back to the grid and what is the price of electricity? I take a modal figure of 15p per KWH as per the figure below to export and use the Q1 2025 price cap as the reference price for electricity. This choice of number is critical and forms a key part of the later analysis.

How many solar panels do you need? This is a critical point, the rule of thumb is that you need enough solar panels to cover your electricity requirement with a 25% cushion. This is defined by:
Number of panels = energy requirement (kwh) / Output of Solar panel in kw x Peak sunlight hours
I take the panel size as 350W as standard and then model 2 assumptions on peak sunlight hours. Firstly, that the number of peak sunlight hours is 50% of average daylight hours (2.1 hours per day and then the voltanic average (2.5 hours per day). I’ve also taken an industry average of the number of panels they recommend for the median home (a 2-3 bed semi as per the previous piece on heat pumps)1
What’s the installation cost? Moneysavingexpert puts the number at £700 per solar panel, whereas an average of a few other retailers put the number at £558 per solar panel (This has resulted in a spike in spam I receive so someone clearly is making good money from selling solar panels). This creates multiples scenarios, from which I average out the results.

The Results

The first thing to state is that on average the installation costs across the examples is £6.8k, so we get back into the argument of who can afford the upfront costs. However, bear with me we’ll get to that. The important thing to note here is that on average the number of years it takes to pay off (at the Q1 2025 price cap levels) is 11.4 years. As of 2022, the average time a household stayed in a home was 10.1 years, this means this is a £750 hit to the average household. Not great, but not the numbers we were looking at with heat pumps.
Ok so now let’s do a lifecycle analysis with a 20 year lifecycle on solar panels and assuming you must pay the £600 maintenance fee in year 12:

Now we’re cooking! The time to pay off goes up because you must factor the maintenance cost, but overall, you are looking at a total value of £4,584 per household.
So how do you incentivise people to go solar?
Now this is one where I possibly dip too much into my university economics days, but assuming rational agents you just need to make up the £750 hit over your average tenor. If you run these numbers and assume Gilts at 5% and 28.5mm households that can switch, The Government borrows £21.375bn and the economy makes a £49.233bn discounted return. That’s a 130% profit, or 6.5% per year!! Now obviously I make no adjustment for if this is retained as savings or what the spending multipliers might be but very simply for a government that is scratching around for 1% annual growth in GDP, the difference is stark!!
Furthermore, the data on average household occupancy tenor has been going up by 0.9 years every 4 years, that means by 2026 you could be extremely close to the breakeven anyway, so arguably the trade off assuming rational agents will go down anyway!
Fine, time to put down my Econ 101 book
What is the optimal grant given households want to shoulder as little of the upfront possible? Let’s take 2% a year growth as the target. The optimal grant then is to pay £1,234 per household. I would argue though, given so much of the green agenda is framed in terms of what we might have to forgo, being flat would be a brucey bonus here. In which case, £1,728 is the optimal grant and at least at the household level this would be a positive expected return from switching to solar.
There we go then. Everything is grand, let’s pump out those grants and get cracking!
The eagle eyed of you though will have noticed my caveat in point 2 of housekeeping. What’s the price you can export to the grid at?
If you drop the price to just 13.87p per kwh, the grant required to make up the shortfall after 10.1 years is £1,565 for 0% expected return (discounted at 5%) and at 10p per kwh the return is -2.8% a year. If we create an extra 27% of our required electricity from domestic solar (see the second part for the numbers on this), you are essentially competing with “big energy”. Can we really assume that this increase in supply leads to no change in export price? Let’s look at who you are competing with via the Government CFD contracts:
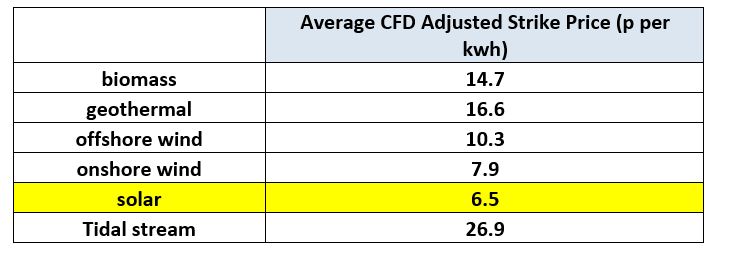
Ahh we may have to rethink this one…
Part 2 of the series will discuss the compromises of scaling household solar energy supply. It also looks at the economics at a system level, the devil in the detail of CFD contracts and why solar looks a like a reasonable option overall in a green mix.
The numbers above are adjusted for available roof space. For an average property the roof area is 70sqm. If you had to go over 50% of available roof space, then you would on average be north facing say for the other bit. This only has 60% of the efficiency of south facing so if you do want to go nuts on your panels just remember that this is limitation. In all examples here it was under 50% of the roofscape. This only really mattered when I was plugging heat pumps in with solar panels as the energy requirement started causing a beta on your output of ~0.9 to your number of panels. However, I’ve put heat pumps in the proverbial bin so I’ve excluded this extra bit of analysis.