

Winter is coming. We know what’s coming with it
If we all know it is coming then why isn’t our energy policy prepared for it? An analytical approach to the truisms we all know in relation to winter

www.marginalcostofeverything.co.uk is now live and is the main portal for MCOE Consultancy services. If you or your firm are looking for advice on how to optimise your energy mix, ensure energy security for your firm, or looking for policy advice at a higher level that is devoid of the absolutism of rhetoric and rooted in pragmatism. Please reach out.

Jon Snow uttered the immortal lines “Winter is coming. We know what’s coming with it”. I’m sure when those words were uttered it wasn’t imagined that they would one day be used in relation to the UK’s energy policy, but bear with me. In many respects what those words were was a truism, something that everyone knew but didn’t really add any value outside of sounding very dramatic in the Game of Thrones universe.
Winter is much the same, we know it’s colder, we know it’s darker, it’s also assumed to be wetter and windier (albeit after last summer maybe this is less certainly held). What does that mean in practice? More heating, more lights, more transport and less outdoor commuting, ergo more energy required. I don’t think it is a stretch to say that people would hold as a truism that we require more energy in winter and that if something is to go wrong it is more likely in the winter.
As a less analytical approach, it’s no surprise that in January and February there is a lot more focus on the wholesale price of energy. It is the middle of winter and we’re conscious of the heating being on. My X feed can attest to that. But lets actually put some meat on this. Does it hold that winter is the key period for any energy strategy?
Building a model
Compiling the source data was a pain here, thankyou to the NESO (the guys who operate the grid and the balancing mechanism), for filling my days with joy in their database. Anyway, what I did was try to build an all encompassing model for what drives the wholesale price of energy.
Now remember, as per my article on CFD contracts, even if the wholesale price is low, that won’t necessarily be the price we pay as the government floors the price, meaning that the difference is paid out by the Government and that cost comes into the price cap, under “policy costs”. However, given right now, only those with lots of lovely inflation-compounding are activating the contract, the majority of the variance should be explained by a model.
So this is the model. The fossil fuels vs renewables ratio, total generated (proxy for demand), wind variation vs mean, temperature deviation vs mean, sun seasonality vs wholesale energy prices. This is the result:

So close but no cigar, the magical 0.5 just outside of reach on the Rsquared. I’m conscious of losing people with Stats overload but in essence, my model explains 48.3% of the variation in wholesale energy costs. In science, a model is considered acceptable if over 50% is explained. But in reality, this shouldn’t be a major surprise, there are variables I’ve omitted.
A key one is forecasting errors and last minute balancing costs. Take the 8th January this year when the NESO had to issue an emergency notice:
“The Electricity Margin Notice (EMN) – a standard tool in our operational toolbox – was issued at 20:30 on Tuesday 7 January showing a shortfall of 1,700MW compared to where we would want the margin to be for the period 16:00 to 19:00 on 8 January.
…in line with how the system is designed, we would expect on a day like 8 January, when we are using our tools to seek a response from the market, that balancing costs would be higher than on a typical day. The costs NESO incurred for balancing the system on 8 January were £21M.”1
I’ll be honest, I’m still working through that data. It’s exceptionally hard to present cleanly, which I’m sure has absolutely nothing to do with the NESO not wanting to show the inside of the sausage machine for fear someone might point out there is an issue.

What are we missing?
So leaving that obvious hole, lets dig into our model again. Let’s take key variables and run a quantile analysis. This relaxes the assumption that you have a constant reaction function. In a nutshell, think of it like how you would react to a change in temperature.
You’re wearing a coat and jumper and the temperature goes from 5 to 7 degrees, it’s now less chilly. The temperature goes from 7 to 9… ok, you’re starting to feel a tad hot. It goes from 9 to 11 you remove your coat. It goes 11 to 13 you stay the same, it goes from 13 to 15, you remove your jumper. If you are solving for clothing items removed as temperature rises, clearly it is not a constant path. You don’t remove your clothing one stitch of material at a time; certain triggers happen that cause outsized reactions at certain points. That’s what we are looking for here.
Wind Ratio vs average

This shows when the wind ratio goes below 40% of normal, the impact on prices goes up, but increasingly so. It’s non-linear and has a much bigger effect when wind reduces below a certain level.
Temperature deviation from average in a given month

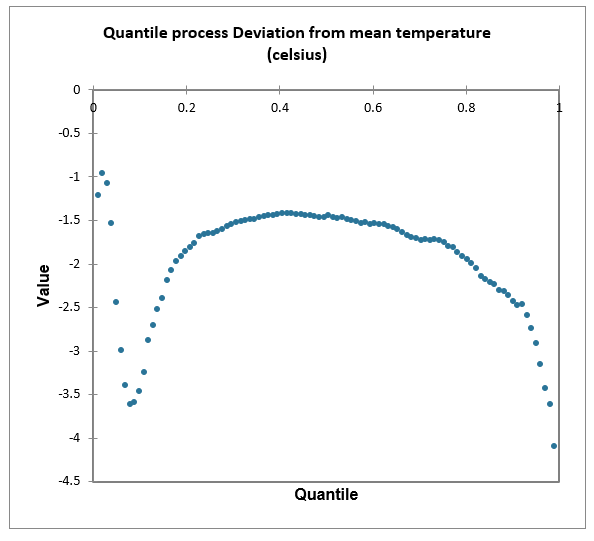
Again, the impact on energy prices gets bigger the more you deviate away from the average, my linear model wasn’t picking this up.
Total generation (demand proxy)

This one is particularly telling. The impact gets bigger the more demand you have, ergo you don’t just remove a sleeve, you remove your jumper. It’s an exponential relationship.
Weather Seasonality

This last one is crucial, clearly the relationship gets more extreme the deeper into winter we get. So, let’s put away the charts and stop massaging my fragile ego for a moment. What does this actually mean?
In a nutshell you can’t describe the wholesale energy market with a simple ruler through the chart and a line of best fit. The deeper into winter you go, the higher the demand requirement and the lesser the solar involvement, with a correspondingly higher impact on wholesale prices. This backs up the idea that even though seasonality is predictable, we are still at the whim of the seasons, and therefore, do not have a good enough mechanism to smooth out these periods of peak usage.
Furthermore at an already sensitive time, if you have fluctuations in wind and temperature, a la 8th January when a high pressure system was over the UK; dropping temperatures and reducing wind relative to normal for January, you get outsized effects here too. This is the challenge for the NESO, as the costs of imbalance in the system are both higher and more frequent, given modelling the weather affects both the supply and demand in a renewables world.
What’s the punchline?
This is where we delve into the highly charged debate over the fossil fuel mix. In winter, solar goes down and demand goes up, all else equal, the amount of fossil fuels we use goes up. Both sides of the debate use this to either prove that “see! wholesale prices have gone up with gas usage, therefore we need more renewables” or “look! renewables have failed and now we have higher prices”. The truth as ever is not absolute.
For a start I repeat the point that the CFD contracts are badly designed and mean we can’t have falling energy prices. Over time, prices move up and the contracts are linked to inflation (The BOE targets 2% CPI, ergo prices go up 2% a year). But let’s assume we sort that out, you still have the major issue of what to do in the winter.
Prices go up with gas usage because we pay for the last thing that can be turned on, which is gas, and when demand is high prices move higher in a non-linear fashion.1So if you could smooth out the demand that would help, but I‘m not mandating blackouts for the common good. Instead you have to look why at we pay such a high price, when we are left with no other alternative than gas.

It’s all about the storage
This is the current situation with gas storage:

That’s only 7 days of peak usage storage (vs Germany at closer to 90 days as a comparison). Over time there has been a conversion of existing gas storage infrastructure to a holding facility for foreign markets instead. Why don’t we have a strategic reserve we can turn on in winter?
Furthermore you have the flow argument. Gas can only move at around 25mph:

As can be seen here only 30% of the daily requirement can be sourced by our existing storage. So no wonder we have to be lastminute.com and buy in internationally competitive markets. It’s like turning up at a hotel at 10pm, asking for a room and then complaining that you don’t get the same price as on a price comparison site for 6 months time.
This is what we need to be trying to solve. Now do we do it with more gas storage, or more hydrogen and hydrogen storage? I teased this in my last piece on Solar Panels and I’ll explore it in my next piece.
www.marginalcostofeverything.co.uk is now live and is the main portal for MCOE Consultancy services. If you or your firm are looking for advice on how to optimise your energy mix, ensure energy security for your firm, or looking for policy advice at a higher level that is devoid of the absolutism of rhetoric and rooted in pragmatism. Please reach out.
This intuitively makes sense. Imagine a 0.1% chance of blackouts in any period, if this goes to 0.2% so what. If it goes to 10%, now you have the cost of the hit to the economy if there were blackouts. Given the highly optimised secondary/tertiary nature of our economy, the impact is much bigger than the cost of the fuel, so you’ll pay whatever it takes the keep the lights on. You are paying for desperation.